Key Findings:
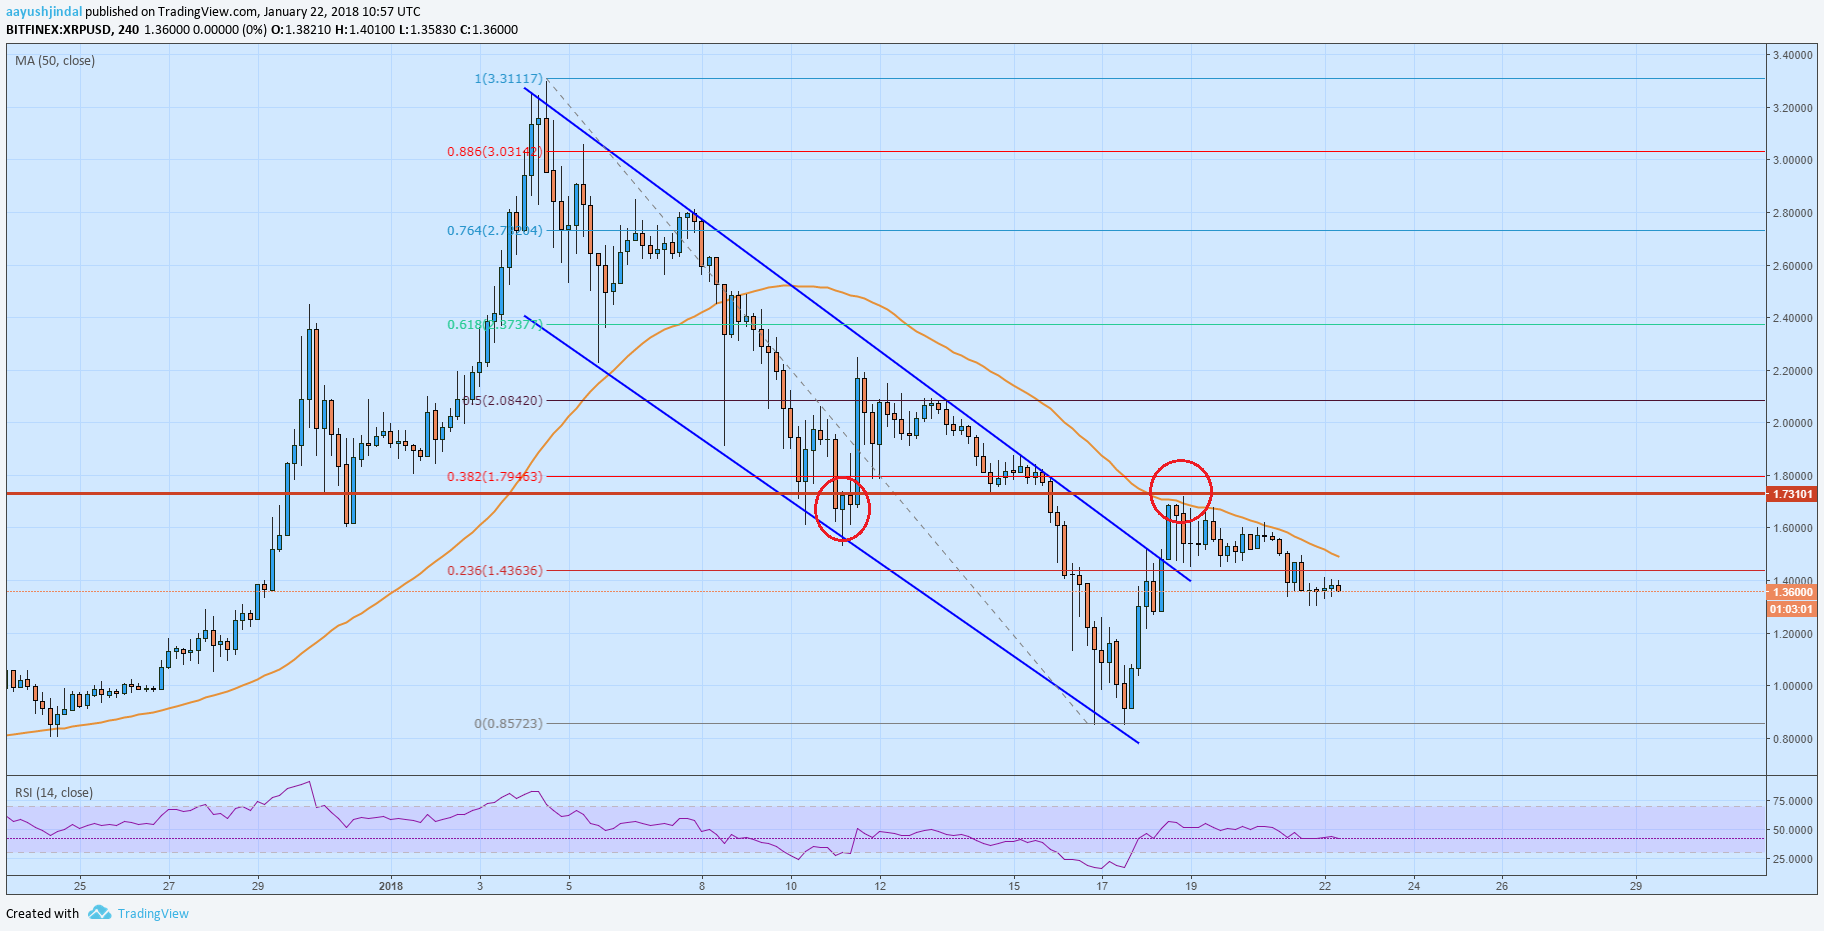
- There was a break above a descending channel with resistance at $1.40 on the 4-hours chart of XRPUSD, which cleared the path for a recovery.
- The current recovery in ripple price is encouraging, but upsides are capped by $1.73 versus the US dollar.
- The pair must settle above $1.70-1.73 and the 50 simple moving average (SMA) to gain bullish traction.
Ripple price to decline once again?
After a major decline, ripple price found bids above the $0.80 level against the US dollar. The price formed a low around $0.857 and started an upside correction.
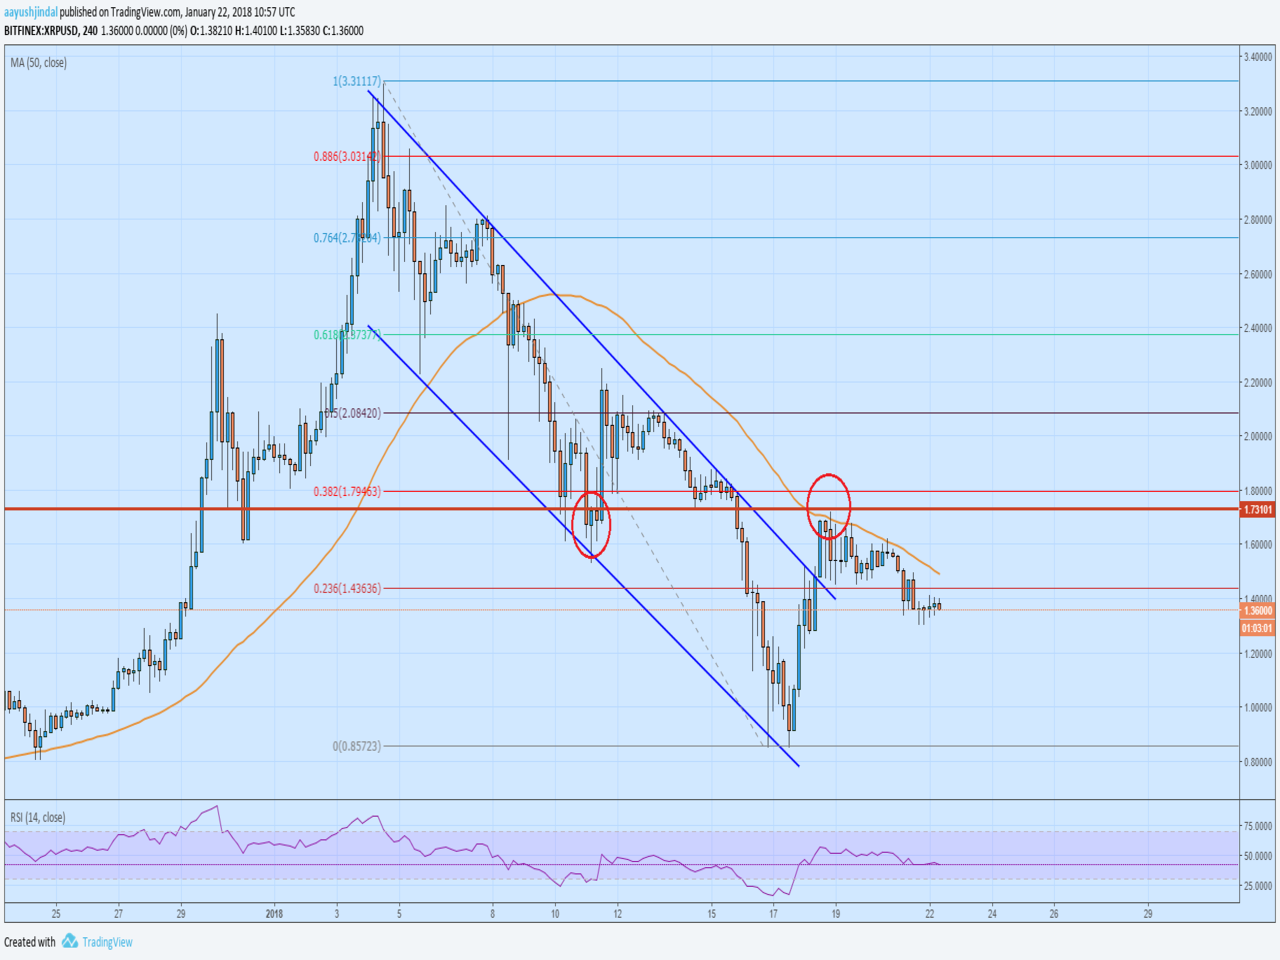
It moved above the 23.6% Fib retracement level of the last major drop from the $3.311 high to the $0.857 low. More importantly, there was a break above a descending channel with resistance at $1.40 on the 4-hour XRPUSD chart.
It opened the door for more gains toward $2.00. However, the upside move found a strong resistance near $1.73. The $1.70-1.75 area was a support earlier, and it is now acting as a barrier for buyers.
The pair almost touched the 38.2% Fib retracement level on the last major drop from the $3.311 high to the $0.857 low, before starting a downside move. Looking at the chart, it seems like the 50 SMA (4-hour, orange) represents a strong resistance, which corresponds to the $1.43 price level.
The price is following a declining path, along with the 50 SMA, and is presently trading at $1.36. Should ripple decline further, the next stop could be the $1.20 support level.
Below the mentioned $1.20 level, price will most likely move back in the bearish zone and resume its downtrend. To avoid further losses, XRPUSD must settle above the 50 SMA and then break through the $1.73 resistance.
A successful close above the $1.73 price level would negate selling pressure. In the mentioned scenario, the price may perhaps trade above $2.00 in the near future.

