Ethereum price continued plummeting during last week's trading sessions, falling from $515 to around $383 at the beginning of the current week. Ethereum lost around %25.6 of its market capital during the past week. Ethereum's market is being affected by a major bearish wave that has been also affecting other major cryptocurrencies namely bitcoin, bitcoin cash and ripple. Technically, there are no signs of recovery soon on the ETHUSD charts.
How low can we expect ethereum price to go during the current week?
Testing an important support level on the 4 hour ETHUSD chart:
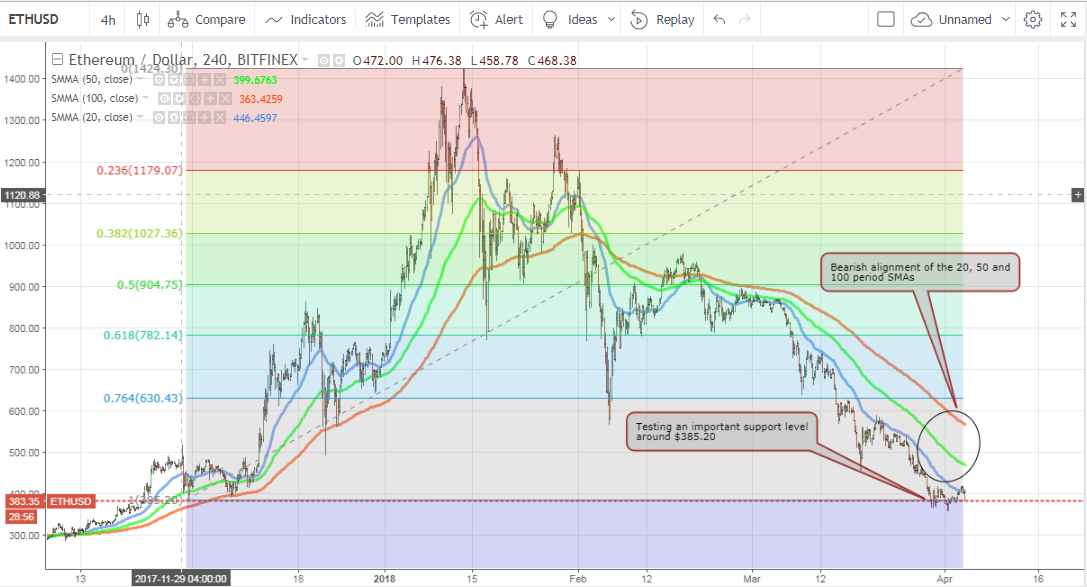
Let's examine the 4 hour ETHUSD chart from Bitfinex, while plotting the 20 period SMA (blue curve), the 50 period SMA (green curve), and the 100 period SMA (red curve) as shown on the below chart. We can note the following:
- To outline main important resistance and support levels as per the current market conditions, we will extend Fibonacci retracements between the high recorded on January 13th, 2018 ($1,424.30) and the low recorded on November 30th, 2017 ($385.20). As we expected during our previous ethereum price weekly analysis on March 27th, ethereum price has dropped down and is currently testing the support level around $385.20. As the bearish wave is still strongly active, this support level will most probably be breached early during the current week.
- The 20 period, 50 period, and 100 period SMAs are exhibiting a bearish alignment. The 50 period SMA has crossed below the 100 period SMA, and the 20 period SMA has crossed below both of them as shown on the chart. Moreover, ethereum price has been below the 20 period SMA during most of the past week. Even though ethereum price has soared currently above the 20 period SMA, analysis shows it will most probably drop again below it within less than 24 hours. This reflects the strength of the current bearish wave and that ethereum price will most probably drop towards the next support level as we will see later.
Red (bearish) Ichimoku Cloud on the 1 day ETHUSD chart:
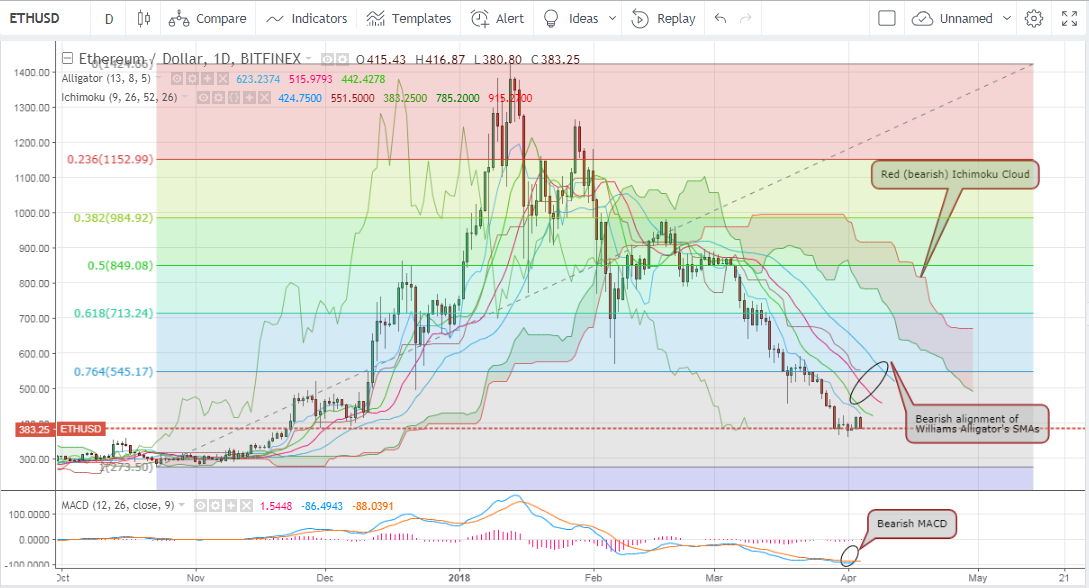
We will examine the 1 day ETHUSD chart, while executing the Ichimoku Cloud, the Williams Alligator indicator, and the MACD indicator as shown on the below chart. We can note the following:
- To identify the support level below $385,20, we can plot another Fibonacci retracements extending between the low recorded on October 23rd, 2017 ($273.50) and the high recorded on January 13th, 2018 ($1,424.30). As such, the next support level below $385.20 lies around $273.50. So, as the bearish wave is still active, we can expect ethereum price to drop during the current week towards $273.50.
- The Williams Alligator's SMAs are exhibiting a strong bearish alignment. The red SMA (teeth) is between the blue SMA (jaw) from above, and the green SMA (lips) from below. The three SMAs are sloping in a downwards direction and the gap between them is significant, which reflects the strength of the current bearish wave. The alligator's mouth is said to be "open and eating" in a bearish direction.
- The Ichimoku Cloud is red (bearish). Ethereum price is below the cloud. The Conversion Line (blue line) is below the Base Line (red line). Moreover, ethereum price is below the Base Line. All of this reflects the strength of the current bearish wave.
- The MACD indicator is also exhibiting a strong bearish signal. Its value is in the negative territory. Also, the red signal line has crossed above the blue MACD line.
- The most logical scenario this week is for ethereum price is to continue dropping towards the support level around $273.50.
Conclusion:
Ethereum price dropped by more than 25% during the past week. As per our technical analysis, ethereum price will most probably break through the support level around $385.20, and fall towards the next support level around $273.50 during the current week.
Charts from Bitfinex, hosted on Tradingview.com

