Ethereum price recovered during the past week rising from around $392 at the beginning of the week to a week high of $530. Higher highs have been recorded during every day's trading session all throughout the past week. This denotes that the bearish trend that has been evident all throughout March has been successfully aborted by the market's bulls. Ethereum price is currently rising towards a crucial resistance level around $545.17. If the market's bulls can successfully breach the resistance around this level, we can expect ethereum price to rise towards the next resistance around $713.11 during the upcoming week.
So, will ethereum price continue rising steadily throughout the upcoming week? Or can we expect to see downwards price correction attempt interrupting the new bullish trend?
Three White Soldiers Candlestick Pattern Obvious on the 1 Day ETHUSD Chart:
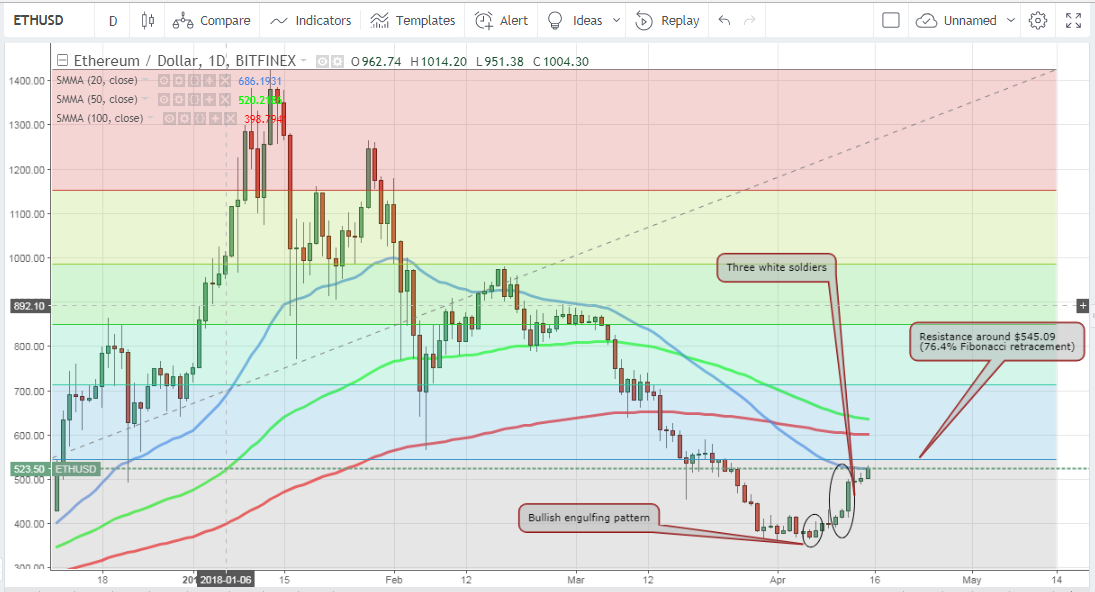
Let's examine the 1 day ETHUSD chart from Bitfinex while plotting the 20 period SMA, the 50 period SMA, and the 100 period SMA. We will also extend Fibonacci retracements between the high scored on January 13th, 2018 ($1424.30) and the low recorded on October 23rd, 2017 ($273.50) as shown on the below chart. We can note the following:

- During the past week, ethereum price has been recording higher highs each and every day, scoring around 28% rise so far. A "bullish engulfing" candlestick pattern marked the beginning of the current upwards trend. The body of the bearish candle of April 6th is contained within the body of the bullish candle of April 7th. The interpretive power of this candlestick pattern originates from the change of market sentiment from a bearish gap down of the opening price of the bullish candlestick (April 7th) to its relatively large body that closes to a price higher than that of the previous day (April 6th). This denotes that the market's bears have overdrawn their welcome and that the bulls have taken over the reins.
- A "three white soldiers" candlestick pattern has been formed during the past week which serves as another bullish reversal signal. As this pattern has appeared after a long downtrend period, it represents an appealing opportunity for traders to open new long positions. The significance of this "three white soldiers" patterns increases as it is proceeded by a "doji" candlestick as shown on the above chart.
- The market is heading towards a significant resistance around $545.09, which represents the 76.4% Fibonacci retracement. As per the aforementioned bullish signal, this resistance level will most probably be breached during the upcoming 24-48 hours. If this resistance level is successfully breached, the next resistance level lies around $713.11, which corresponds to the 61.8% Fibonacci retracement.
- Ethereum price have successfully risen above the 20 period SMA, which reflects the current bullish sentiment of the market. Moreover, the 50 period SMA is above the 100 period SMA, which also represents a bullish signal. The bullish wave can be expected to become even stronger when candlesticks rise above the 50 period SMA and the 100 period SMA.
Greenish (bullish) Ichimoku Cloud on the 4 hour ETHUSD Chart:
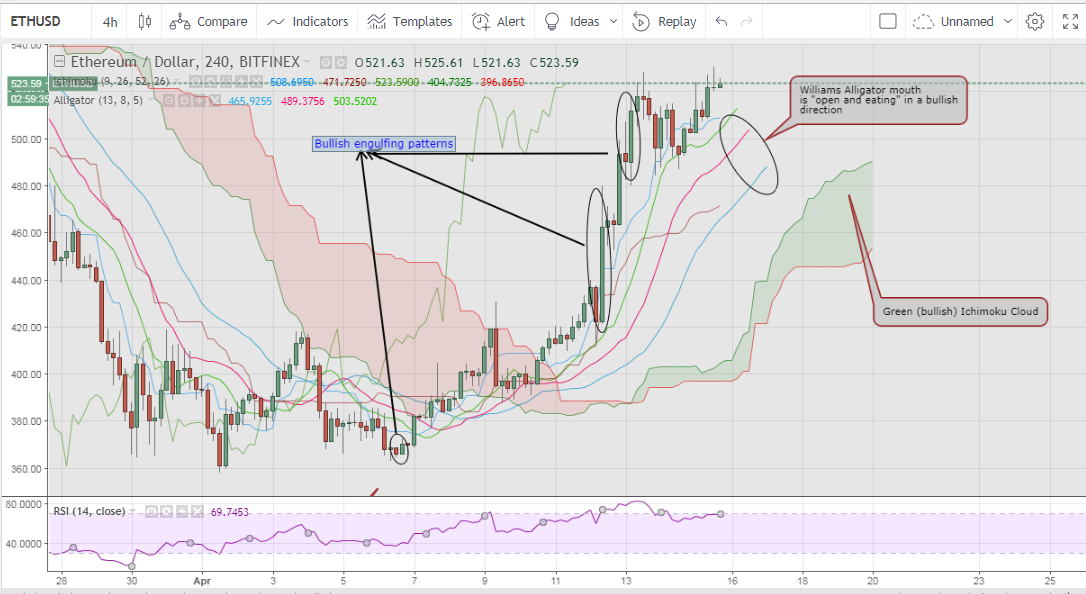
Now, let's examine the 4 hour ETHUSD chart from Bitfinex, while plotting the Ichimoku Cloud, the Williams Alligator indicator, and the RSI as shown on the below chart. We can note the following:

- The strength of the current bullish wave is evidenced by three "bullish engulfing" candlestick patterns that formed during the past ten days. These represent strong bullish reversal patterns and reflect how the market's bulls have taken the reins and have the power to break through the resistance around $545.09.
- The Ichimoku Could has turned into the green color. Ethereum price has moved above the cloud. Also, the Conversion Line (blue line) has moved above the Base Line (red line). Moreover, ethereum price has moved above the Base Line. All these four signs are bullish signals that confirm the strength of the current bullish wave.
- The Williams Alligator's SMAs are exhibiting a bullish alignment, so we can say that the alligator's mouth is "open and eating" in the bullish direction.
- The most probable scenario this week is for ethereum price is to break through the 76.4% Fibonacci retracement ($545.09) and head towards the next resistance level around the 61.8% Fibonacci retracement ($713.11).
Conclusion:
A strong bullish wave is currently evident across the ETHUSD market. As per our technical analysis, ethereum price will most probably continue rising to break through the resistance around $545.08 and head towards the next resistance around $713.11 during the upcoming week.
Charts from Bitfinex, hosted on Tradingview.com

