Ethereum price continued dropping during the past week, recording a week low of $455, which is a price level that hasn't been recorded since December 2017. After the week's low was recorded on Sunday, ethereum price started to recover, and the market's bulls managed to push the price upwards to a day high of $562 on the very same day. Last week, ethereum price dropped from 719.85 down to 536.73, accounting for around 25.4% decline in value.
Can we expect to see the bearish wave reverse during the current week? Or, will ethereum price continue dropping after a brief upwards price correction attempt?
Piercing pattern signals upwards price correction on the 4 hour ETHUSD chart:
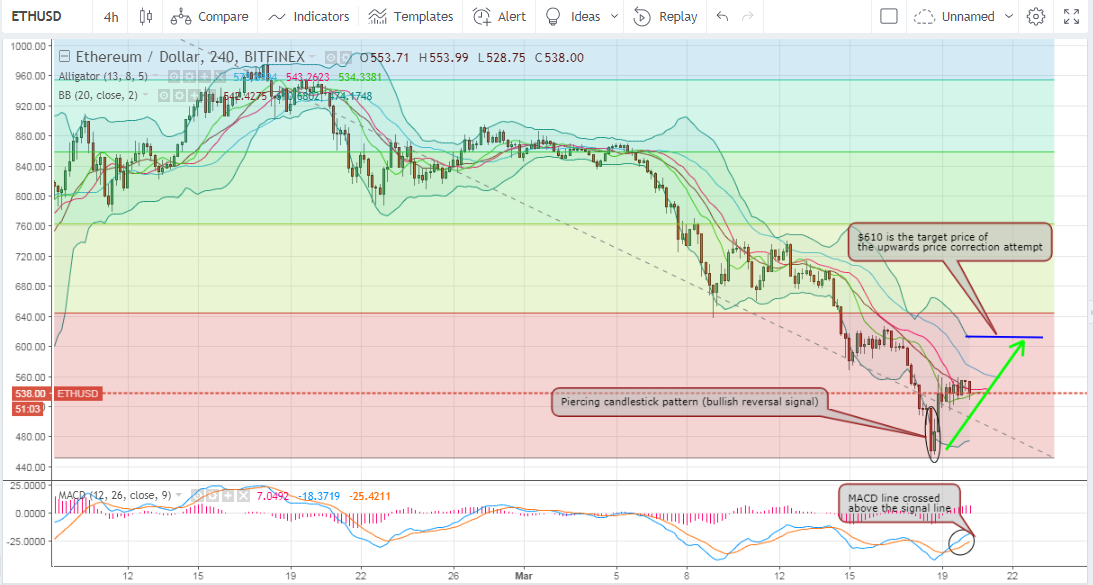
Let's examine the 4 hour ETHUSD chart from Bitfinex, while plotting the Bollinger Bands indicator, the Williams Alligator, and the MACD indicator, as shown on the below chart. We can note the following:
- To identify important resistance and support levels at the current stage, we will plot Fibonacci retracements extending between the high recorded on January 28th ($1,265) and the low recorded on March 18th ($452). After dropping down to the bottom level (0%) of this Fibonacci retracement ($452), ethereum price started rising. This level represents a strong support level that also prevented further price drop in December 2017.
- A "piercing" candlestick pattern was formed last Sunday. This pattern represents a bullish reversal sign that signaled the beginning of an upwards price correction attempt that pushed the price upwards to a high of $562 on Sunday. This price correction attempt is likely to continue on during the current week and can take the price up to test the resistance around $610. If the market's bulls breach the resistance around $610, they will be faced by another resistance around $643.87, which corresponds to the 23.6% Fibonacci retracement level.
- The price correction attempt started when candlesticks began touching the lower Bollinger band (i.e. ethereum was oversold). Also, the new upwards wave has been confirmed by the MACD, as it started sloping in an upwards direction and the blue MACD line has just crossed above the red signal line.
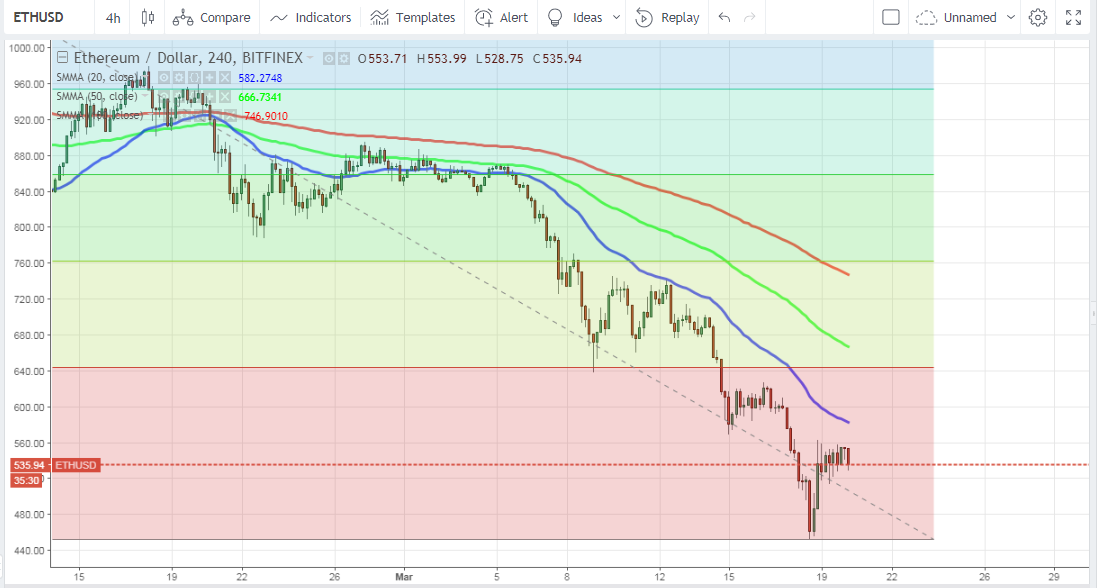
- Even though an upwards price correction attempt has started building up, it will mostly be a brief attempt that will last for a few days, after which ethereum price will continue dropping again. This can be evidenced by the SMAs of the Williams Alligator indicator which are still exhibiting a bearish alignment. Also, ethereum price is still below the 20 period, 50 period, and 100 period smoothed moving averages (SMAs) as shown on the below 4 hour ETHUSD chart. Furthermore, the SMAs don't exhibit any bullish crossovers, which reflects that the bearish wave is still strong, even if an upwards price correction attempt has become evident.

Red (bearish) Ichimoku Cloud on the 1 day ETHUSD chart:
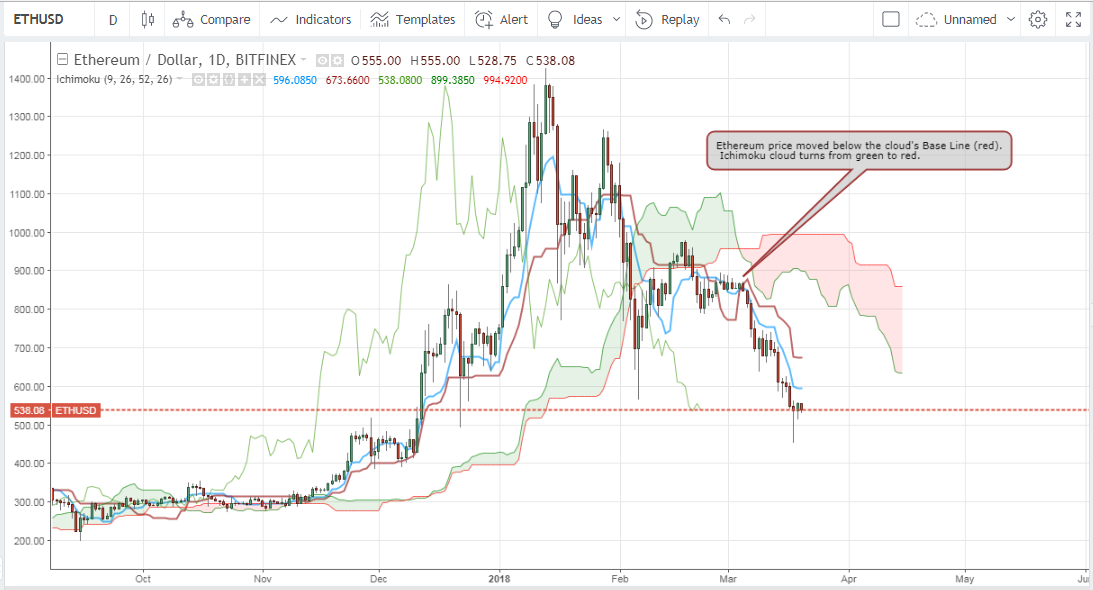
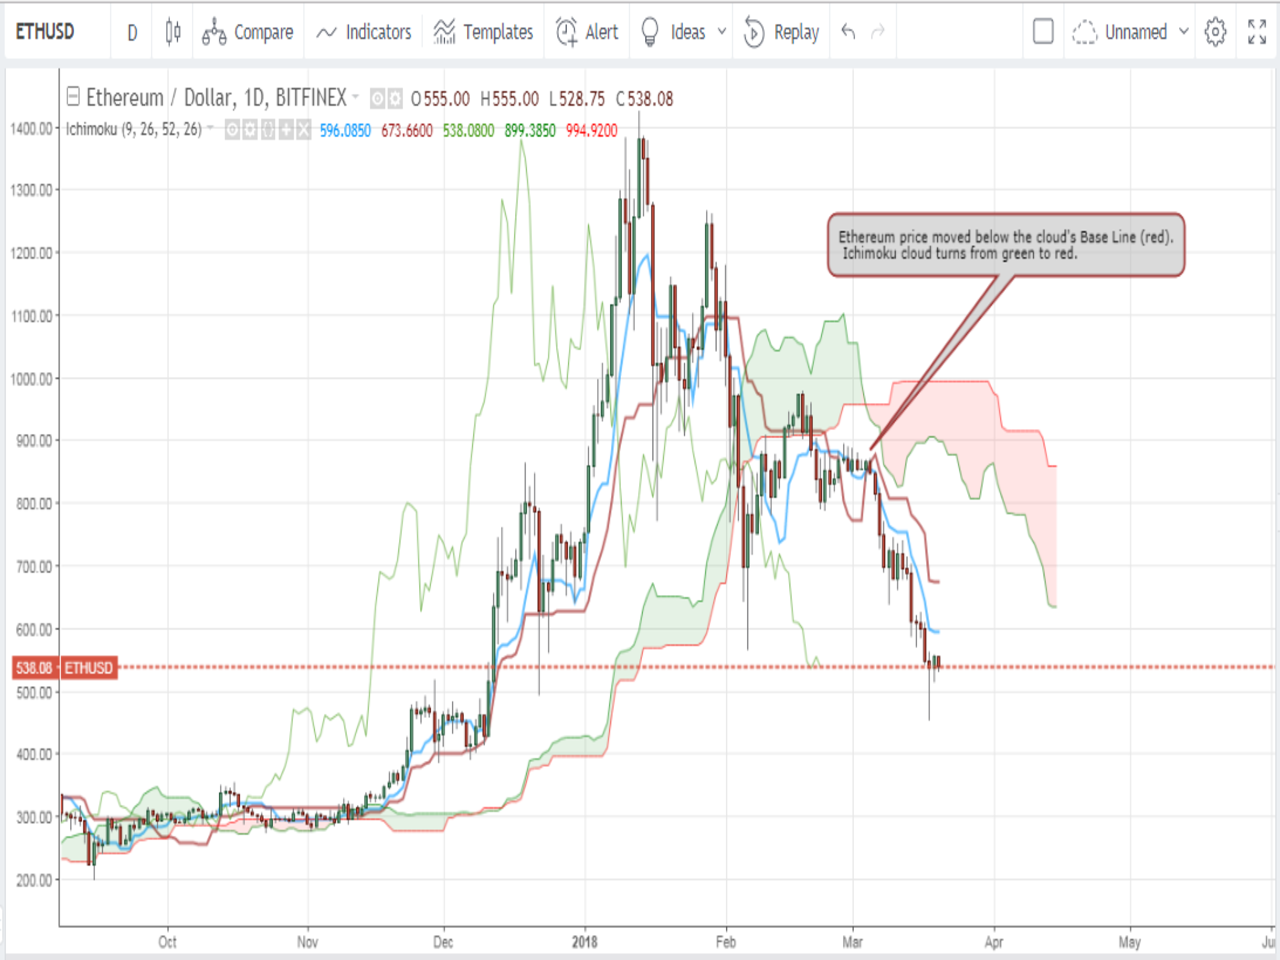
Now, let's study the 1 day ETHUSD chart from Bitfinex, while executing the Ichimoku Cloud indicator and plotting the MACD indicator as shown on the below chart. We can note the following:
- The bearish trend is still active and strong as evidenced by the Ichimoku Cloud. The cloud is red, as the Leading Span A (greenish cloud line) is sloping downwards and below the Leading Span B (reddish cloud line). Also, ethereum price is below the cloud and the Conversion Line (blue line) is below the Base Line (red line). All these Ichimoku Cloud signals are typical of an active bearish wave.
- The MACD indicator is also conveying a bearish signal. It is sloping in a downwards direction and the red signal line is below the blue MACD line.
Conclusion:
Ethereum price dropped by around 25.4% during the previous week. An upwards price correction attempt began building up on Sunday. As per our technical ethereum price analysis, this upwards price correction attempt will be mostly brief and will last no more than a few days. Ethereum price is likely to continue dropping after the price correction attempt faces resistance around $610.
Charts from Bitfinex, hosted on Tradingview.com

