A major sell off pulled ethereum price out of the descending channel throughout which the market has been moving since February 27th. The price of ether dropped down to a low of $776.10 earlier during Wednesday's trading sessions. The market is currently testing a major support level near $778.
How low can ethereum price go before this bearish wave can reverse?
(Note: the market exhibits high levels of volatility at the moment, so trade wisely and never invest more than the amount you can afford to lose).
Strong bearish wave evident on the 4 hour ETHUSD chart:
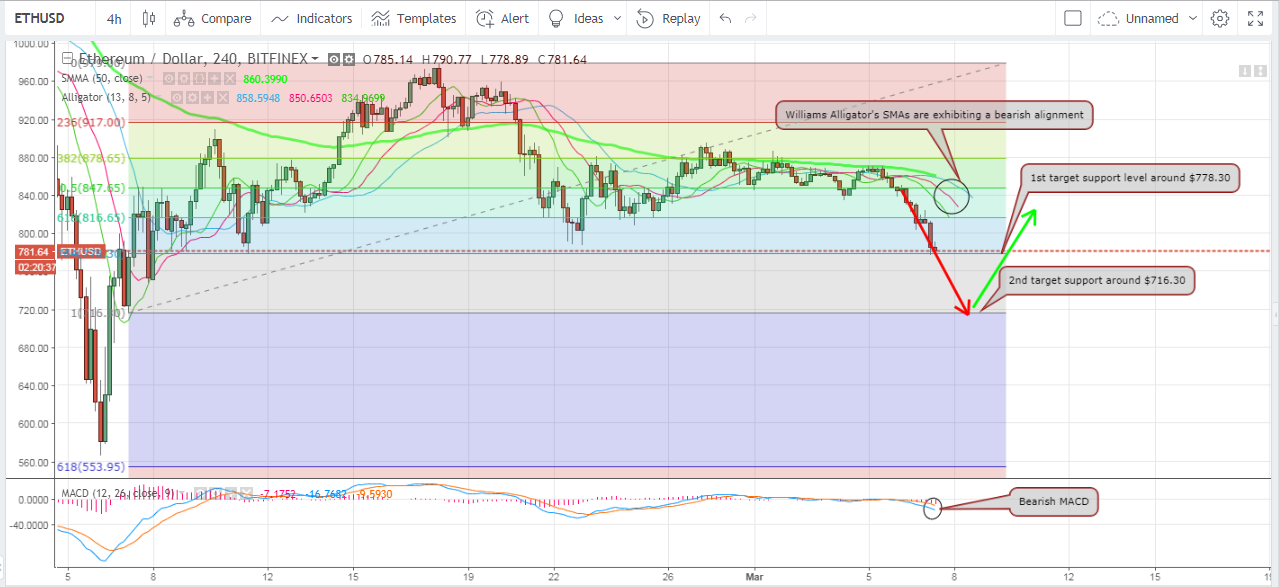
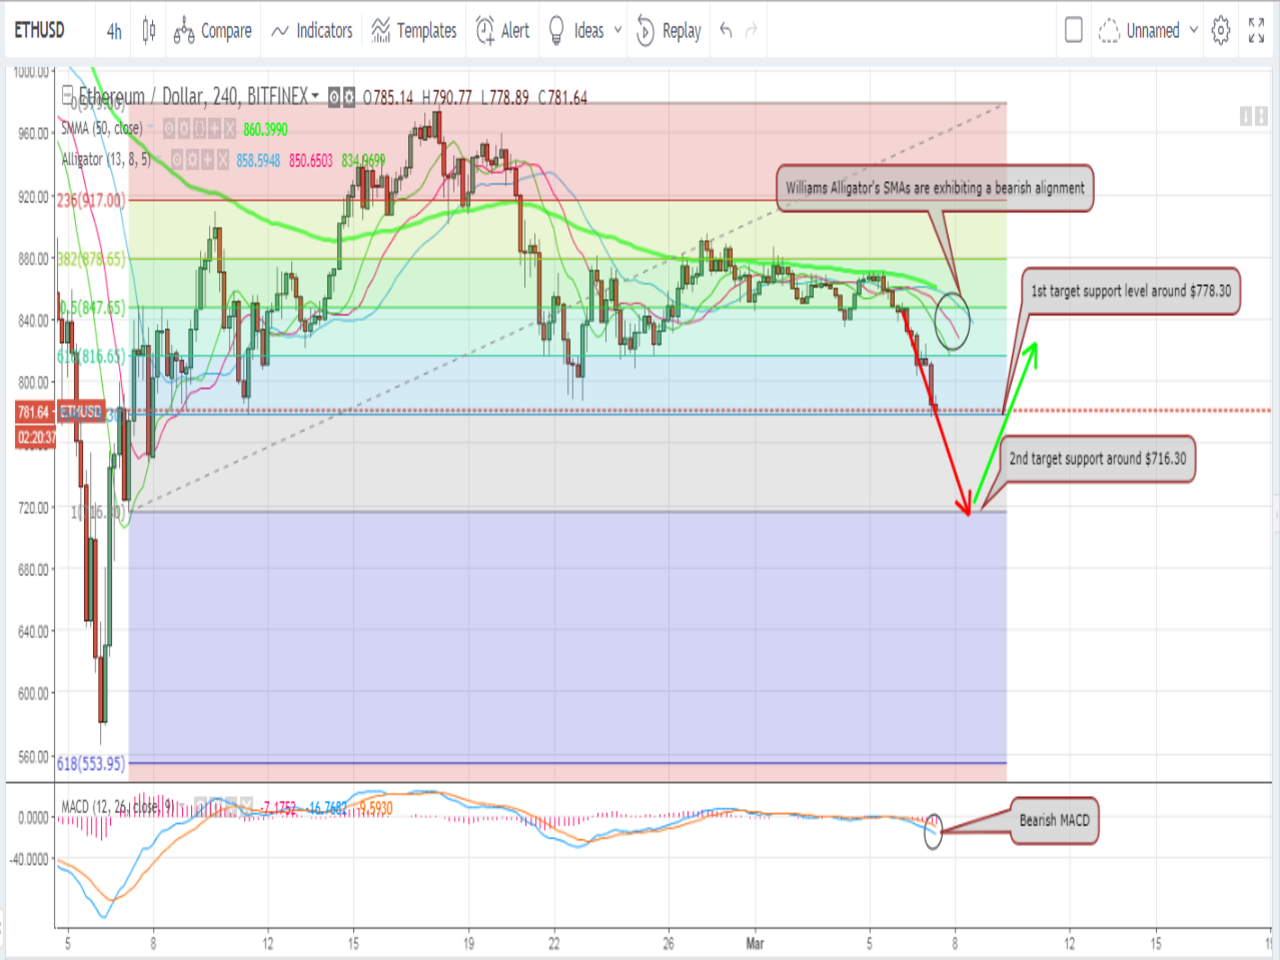
We will examine the 4 hour ETHUSD chart from Bitfinex, while plotting the 50 period SMA, the Williams Alligator indicator, and the MACD indicator as shown on the below chart. We can note the following:
- As the market has witnessed conformational changes during the past 24 hours, we will set up new resistance and support levels. As such, we will plot Fibonacci retracements extending from the low recorded on Feb 7th ($716.30) and the high recorded on Feb 18th ($979). At the time of writing of this analysis, ethereum price is about to test the support level around the 76.4% Fibonacci retracement, which corresponds to $778.30. If ethereum price does not find support around this level, it can continue dropping down to $716.30 where support might be stronger.
- The bearish wave that has started during Tuesday's trading sessions was relatively strong as it pulled ethereum price downwards to break through two support levels: the 50% Fibonacci retracement ($847.65) and the 61.8% Fibonacci retracement ($816.65). Candlesticks moved further away from the level of the 50 period SMA, which reflects that the bearish wave is still strong and is likely to continue pulling ethereum price downwards to the next support level around $716.30 (100% Fibonacci retracement level).
- The Williams Alligator indicator is conveying another bearish signal. Its SMAs are exhibiting a bearish alignment, as the lips (green SMA) is below the teeth (red SMA) and the jaw (blue SMA) is on top of both. So, as the alligator's mouth is open and eating, we are likely to see ethereum price continue dropping near $716.30, before the current strong bearish wave can reverse.
- The MACD is currently in the negative territory. Also, its red signal line is above the blue MACD line and the gap between both is increasing, which reflects the strength of the current bearish wave.
- The most logical scenario is to see ethereum price drop down near $716.30, before the bearish wave can be reversed. Alternatively, ethereum price may less likely find support near $778.30 (76.4% Fibonacci retracement), after overshooting briefly below this important price level.
Conclusion:
Ethereum price fell by around 7% during Tuesday's trading sessions. The bearish wave continued pulling price downwards to $776.10 early during Wednesday's sessions. As per our technical analysis, the price of ether will most probably drop down near $716.30 before the market's bulls can take the upper hand and reverse this strong bearish rally.
Chart from Bitfinex, hosted on Tradingview.com

