Bitcoin cash price dropped by around 17% during the past week, dropping down from around $1,290 in the beginning of the week to $1,080 during Sunday's trading sessions. Since Thursday, BCH price has been oscillating between $1,093 and $965. Bitcoin cash price is currently testing the resistance around $1,093.03, which corresponds to the 61.8% Fibonacci retracement for the third time during the past 72 hours, yet it is very unlikely that the market bulls will be able to breach this important resistance level.
When can we expect the bearish wave that has been controlling the market for the past week to be reversed?
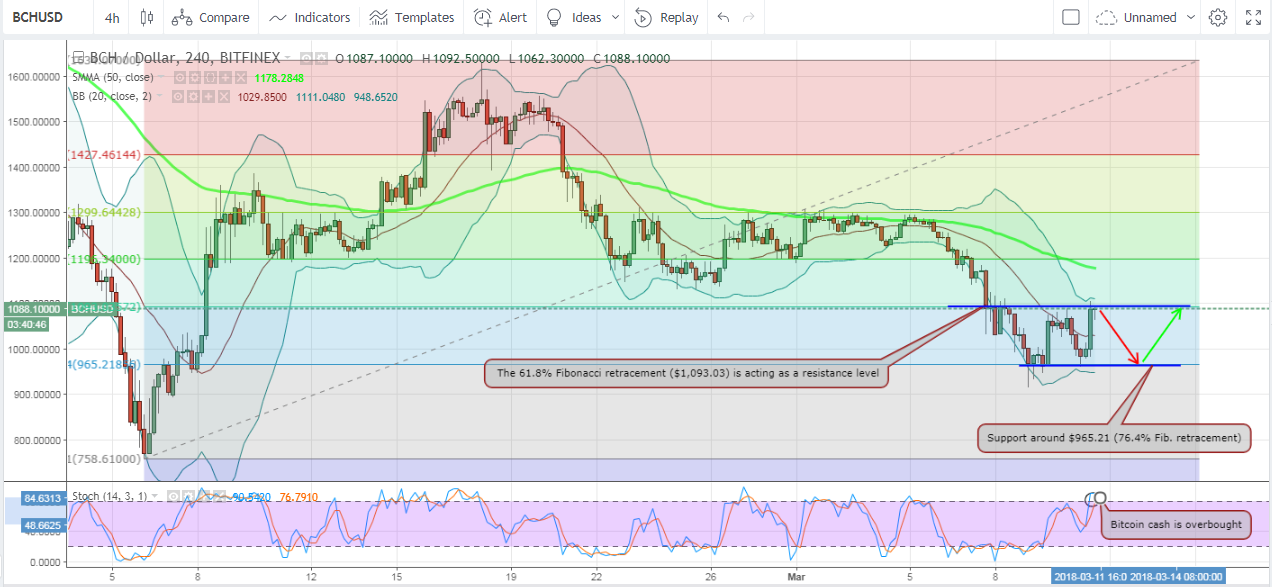
We will examine the 4 hour BCHUSD chart from Bitfinex, while plotting the 50 period SMA, the Bollinger Bands indicator, and the Stochastic oscillator. We will also extend Fibonacci retracements between a low of $758.61 and a high of $1,634.07, as shown on the below chart. We can note the following:

Bitcoin cash price has been moving across a relatively fixed range ($965 and $1,093) during the past 72 hours. As per our technical analysis, bitcoin cash price will most probably drop again to test the support level around the 76.4% Fibonacci retracement ($1,093.03) during the upcoming 24 hours, before an upwards price correction attempt can become evident and push the price upwards to higher levels again.
Chart from Bitfinex, hosted on Tradingview.com
When can we expect the bearish wave that has been controlling the market for the past week to be reversed?
A fixed price range evident on the 4 hour BCHUSD chart:
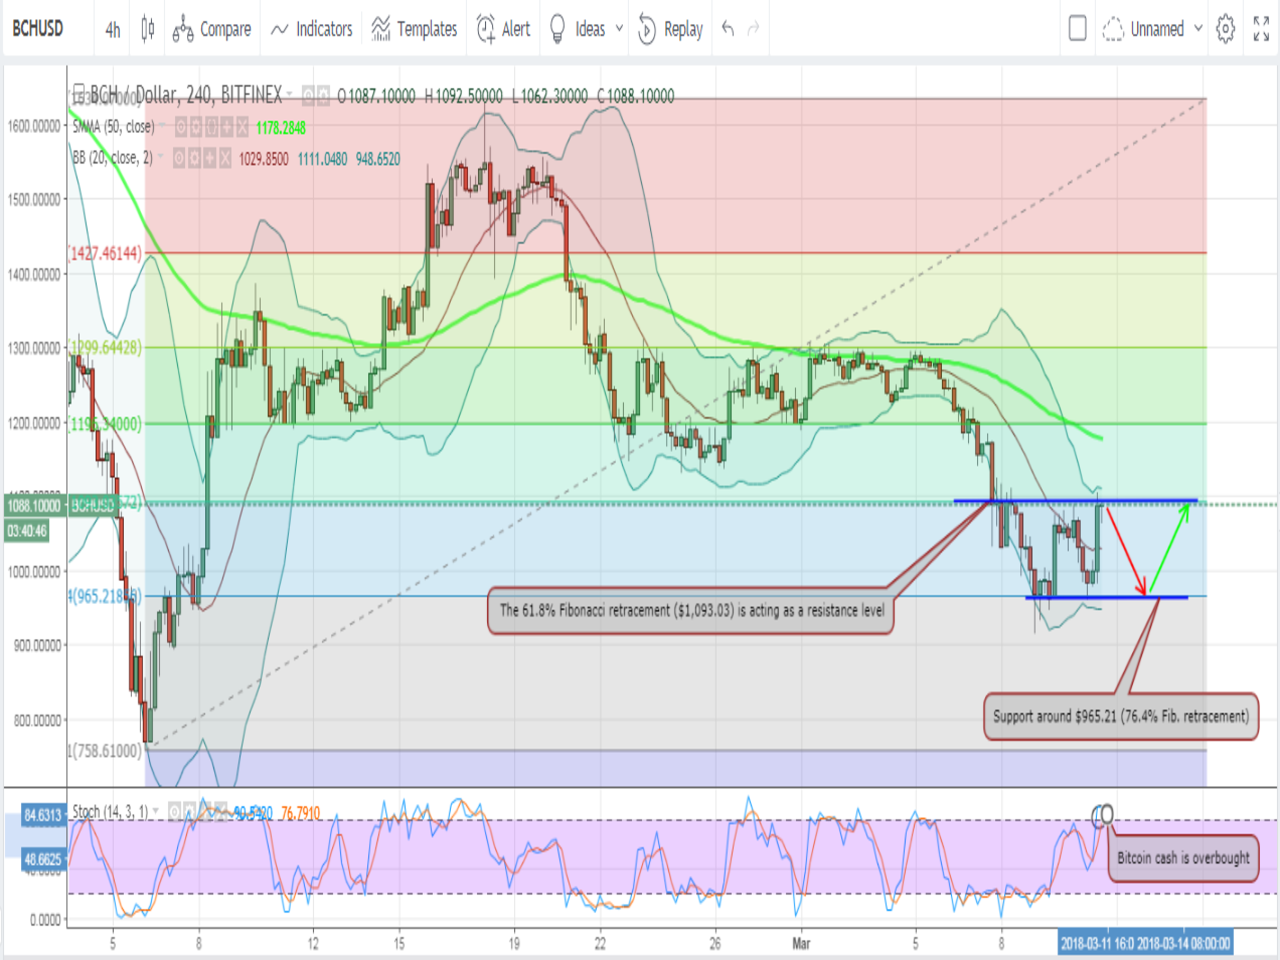
We will examine the 4 hour BCHUSD chart from Bitfinex, while plotting the 50 period SMA, the Bollinger Bands indicator, and the Stochastic oscillator. We will also extend Fibonacci retracements between a low of $758.61 and a high of $1,634.07, as shown on the below chart. We can note the following:

- Bitcoin cash price dropped below the 61.8% Fibonacci retracement level ($1,093.03) on Wednesday, for the first time since the beginning of last week's bearish wave. Since then, BCH price has been moving between the 61.8% Fib. retracement ($1,093.03) and the 76.4% Fib. retracement ($965.21), which are marked by a pair of blue horizontal trend lines on the above chart.
- On Sunday, bitcoin cash price dropped down to a day low of $960, which is around $5 below the level of the 76.4% Fib. retracement. Thereafter, BCH price bounced off this support level and began rising reaching a day high of $1,104, which is around $11 above the level of the 61.8% Fib. retracement. The market's bulls didn't manage to keep BCH price above the level of the 61.8% Fib. retracement ($1,093.03), as it dropped down to $1,071, at the time of writing of this analysis.
- BCH price is currently below the level of the 50 period SMA, which reflects the current strength of the bearish wave that is controlling the market. Also, candlesticks started touching the upper Bollinger band, which means that BCH has become somehow overbought near the level of the 61.8% Fib. retracement. Moreover, the Stochastic oscillator's value is currently around 87, which also confirms that BCH is overbought at the current market price.
- As per the signals obtained for the chart's oscillators and indicators, BCH will most probably drop down to test the support level around the 76.4% Fib. retracement ($965.21) within the next 24 hours. Thereafter, an upwards price correction attempt may push the price upwards again to retest the resistance around the 61.8% Fib. retracement ($1,093.03).
Conclusion:
Bitcoin cash price has been moving across a relatively fixed range ($965 and $1,093) during the past 72 hours. As per our technical analysis, bitcoin cash price will most probably drop again to test the support level around the 76.4% Fibonacci retracement ($1,093.03) during the upcoming 24 hours, before an upwards price correction attempt can become evident and push the price upwards to higher levels again.
Chart from Bitfinex, hosted on Tradingview.com

