After plummeting to a low of $1,136.60 during Monday's trading sessions, bitcoin cash began rising reaching a high of $1,299 during Tuesday's early sessions. Later on, the price dropped down to $1,275 at the time of writing of this analysis. A significant resistance lies around the $1,278.14 price level and is about to be tested during the upcoming few hours.
Where can we expect bitcoin cash price to be heading during the upcoming few days?
Testing the resistance level around the 23.6% Fibonacci retracement:
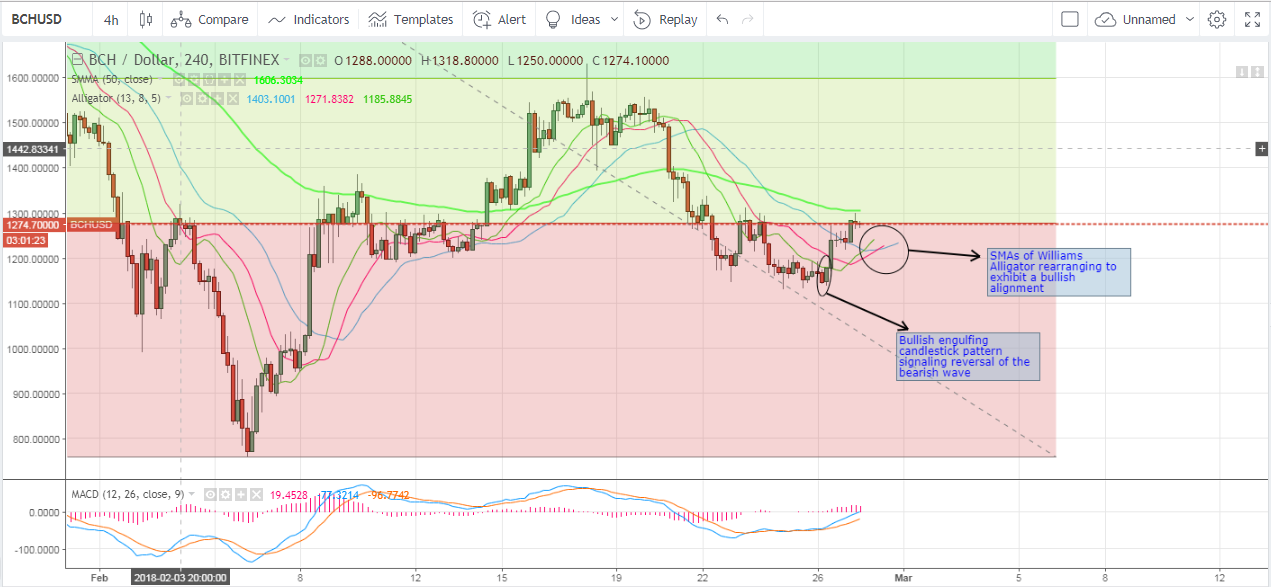
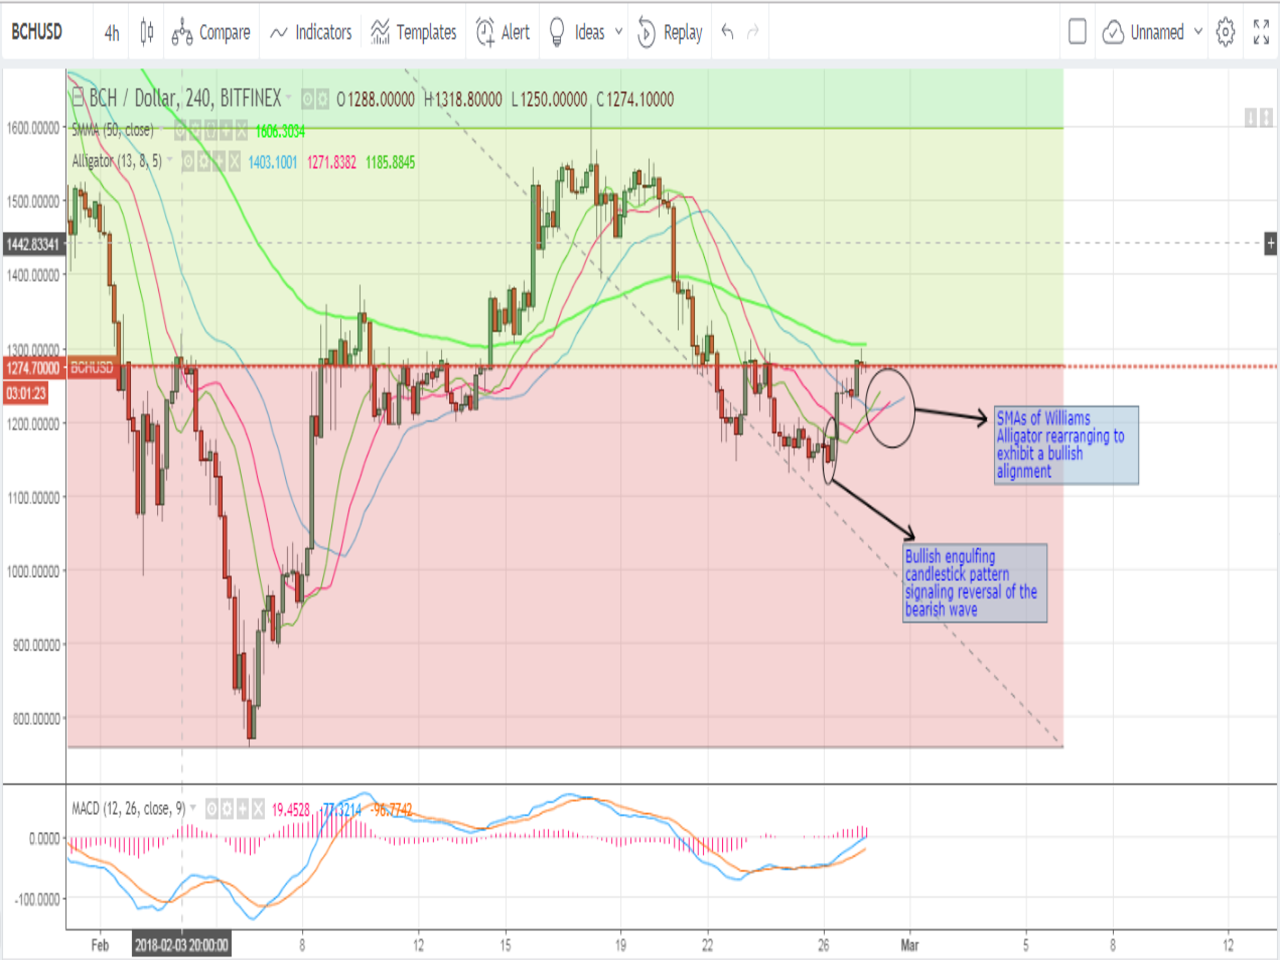
Let's examine the 4 hour BCHUSD chart from Bitfinex, while plotting the 50 period SMA, the Williams Alligator indicator, and the MACD indicator as shown on the below chart. To identify main support and resistance levels, we will plot Fibonacci retracements extending between the high recorded on January 11th ($2,960), and the low recorded on February 6th ($758.61) (Note: the chart was zoomed in after plotting the Fibonacci retracements). We can note the following:
- After soaring to a high of $1,630 on February 18th, a bearish wave began controlling the market until it was successfully reversed during Monday's trading sessions. A "bullish engulfing" candlestick pattern signaled reversal of the bearish wave during Monday's later trading sessions. The $1,135 price level presented a relatively strong support level that prevented further price drop, and reversed the downtrend that has been controlling the market during the past ten days.
- Bitcoin cash price is currently testing the resistance around $1,278.14, which corresponds to the 23.6% Fibonacci retracement. Even though this important resistance level was tested on February 23rd, the market's bulls failed to break through it back then. Right now, it is more likely to see this level broken, especially that it is currently weaker than it was a few days ago. This is evidenced by the 50 period SMA, which is currently just above the candlesticks, and bitcoin cash price will most probably rise above this pivotal moving average during the next few hours. We can expect to see a steeper rate of rise, when candlesticks start forming above the level of the 50 period SMA.
- The SMAs of the Williams Alligator have just realigned themselves to exhibit a bullish signal, so the alligator's mouth is now "open and ready to eat". The red SMA (teeth) has just crossed above the blue SMA (jaw), and the green SMA (lips) has just crossed above the red SMA (teeth). As such, bitcoin cash price is likely to break through the 23.6% Fibonacci retracement within the next 24 hours or so.
- The MACD indicator is also signaling continuation of the newly formed bullish wave. It is sloping in an upwards direction and entering the positive territory. The blue MACD line is above the red signal line and the gap between both is increasing, which indicates that the bullish momentum is building up.
Conclusion:
A new upwards trend is just beginning to control the market, after the bearish wave was successfully reversed during Monday's late trading sessions. Our technical analysis is in favor of continuation of the new bullish wave, so we can see the resistance around the 23.6% Fibonacci retracement ($1,278.14) breached during the upcoming 24 hours.
Chart from Bitfinex, hosted on Tradingview.com

